I have been running Pi-Hole since 2018, and I’m still amazed as to how much ads it actually blocks. It’s simply incredible, and I often run my VPN client on my phone to connect to my home network, just to get DNS filtering no matter where I am.
Due to some recent changes to my home environment, I have now moved to a dual Pi-Hole setup, utilizing Michael Stanclift’s excellent Gravity Sync to keep the Gravity blocklists syncronized between instances.
I am also a heavy user of Home Assistant, so natually I have statistics from Pi-Hole visible in a Dashboard there as well, utilizing the Pi-Hole integration, which works very well. However, with two Pi-Hole instances, I would like to see some combined statistics, instead of them being seperated out by instance.
Thankfully this a very easy to do in Home Assistant, by creating custom template sensors. In my setup, I have two Pi-Hole integrations enabled, one called pi_hole and one called pi_hole02. In order to combine some of the sensors, it’s a matter of creating a new combined sensor with the total values.
Pi-Hole Combined Sensors example#
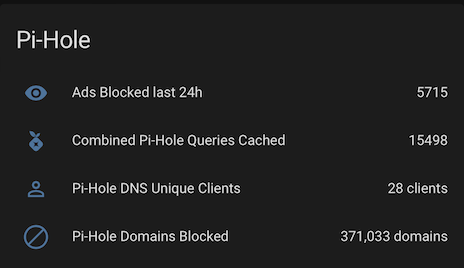
Stick this in your Home Assistant configuration.yaml file, replace the sensor_pi_hole names with your own entity names, and you’ll be able to use two new sensors, namely total_ads_pihole, which is a combination of the ads blocked in the last 24 hours of both Pi-Hole instances, and total_pi_hole_dns_queries_cached which is the total number of cached queries.
Add those to a Entities Card in Home Assistant, and you will have something that looks like this: